
- Bitcoin’s cyclical patterns and momentum indicators suggest a potential rally, with a price target of $300,000.
- Market corrections marked as “Peak Fear” have historically led to strong recoveries, reinforcing Bitcoin’s long-term uptrend.
- The RSI shows Bitcoin nearing oversold levels, a key signal for past price rebounds and continued bullish momentum.
Bitcoin’s price action continues to attract investor attention as it follows familiar market cycles. Analysts point to key technical indicators that suggest another potential rally, reinforcing Bitcoin’s long-term bullish trend.

Historical Market Cycles and Momentum Indicators
Analysts identify specific indicators supporting a potential price surge, aligning with past trends. 0xNobler states that Bitcoin’s price action follows a repeating pattern, with major upward movements occurring after a momentum crossover. The recent indicator alignment signals another rally, setting a price target of $300,000.
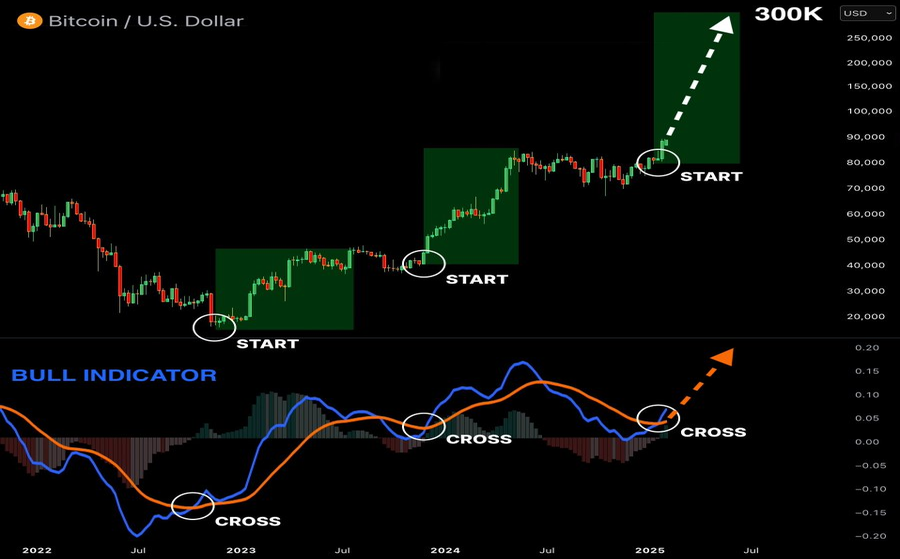
Bitcoin’s historical price movements show three major bullish phases since 2022. The first rally begins in late 2022, leading to a sustained price increase. The second phase emerges in mid-2023, following a similar pattern of consolidation and breakout. The third rally starts in 2024, maintaining the same trend structure. A new bullish momentum crossover appears in early 2025, signaling another potential rally.
The momentum indicator in the lower section of the time frame tracks market trend shifts. The blue and orange lines historically cross at key moments, marking significant bullish reversals. These crossover points align with Bitcoin’s historical breakouts, reinforcing the possibility of a price surge. Bitcoin’s price structure follows a cyclical pattern, each rally aligning with momentum shifts.
Key Market Trends and Fear-Based Corrections
Bitcoin’s price action maintains an upward trajectory despite periodic corrections marked as “Peak Fear.” Mister Crypto states that each “Peak Fear” event causes a sharp price decline, followed by a strong recovery. The time frame’s trendline connects higher lows, illustrating Bitcoin’s long-term bullish structure.

The Relative Strength Index (RSI) tracks market reactions during fear-driven sell-offs. Each drop into the oversold zone triggers a price rebound. The latest RSI movement reaches this critical area again, mirroring past patterns.
Many Market analysts confirm that the trendline provides strong support, reinforcing Bitcoin’s ongoing bullish momentum. Historical movements confirm Bitcoin continues to respect key support zones while maintaining its broader uptrend.