
- MARA’s RSI is at its lowest in two years and a past pattern showed a 1,000% rise after similar lows.
- The stock trades at $9.18 with key support near $8.50 and a possible breakout target of $64.78.
- A breakout above $22 could push MARA higher and past trends suggest strong moves after similar setups.
Marathon Digital Holdings (NASDAQ: MARA) has hit its lowest daily Relative Strength Index (RSI) level in over two years, sparking speculation of a potential breakout. The last time MARA’s RSI reached similar levels, the stock surged by over 1,000% in the following year. The current setup has drawn comparisons to early 2023, where a similar dip in RSI coincided with a rapid recovery and multi-fold price expansion.
Critical Support and Resistance Zones
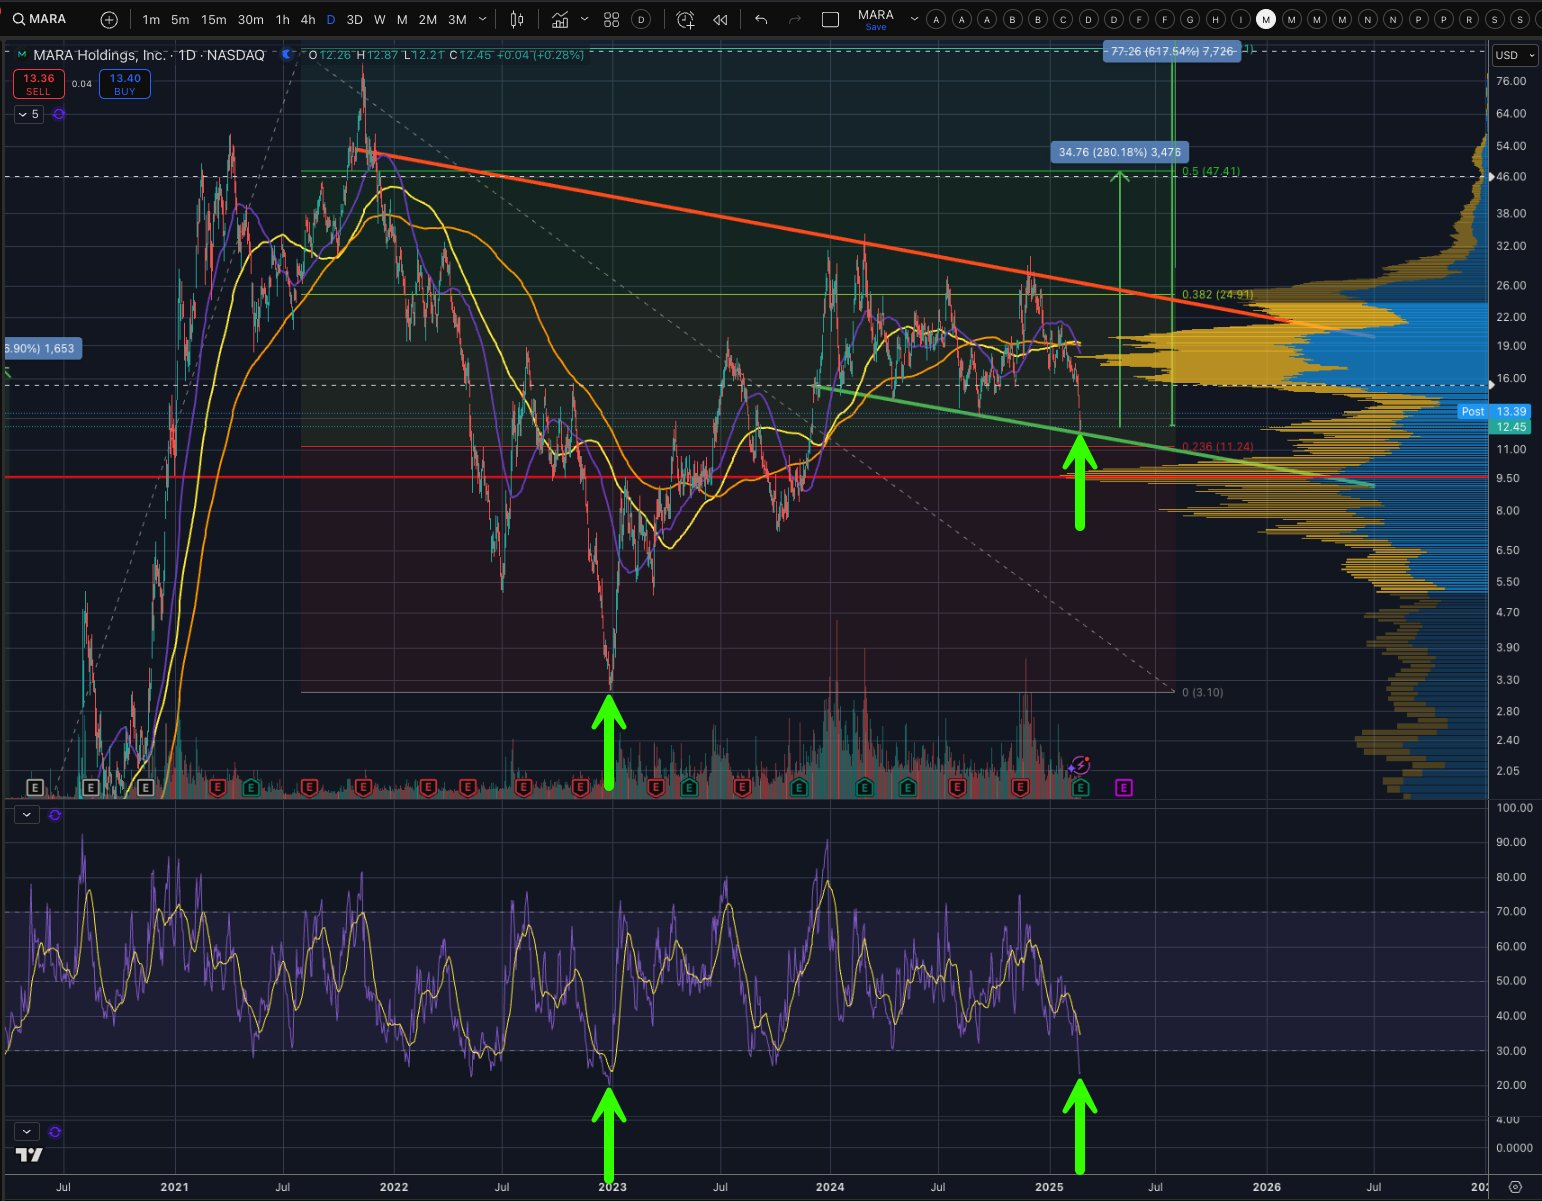
MARA is currently trading around $9.18, sitting just above a historically significant support zone near $8.50. The volume profile shows heavy accumulation in this range, suggesting strong buyer interest. The chart illustrates a descending triangle formation, with resistance around $19.12 and a major breakout target near $64.78—a 600% potential upside if history repeats itself.
Also, price is below the 50-day and 200-day moving averages, a bearish sign. But in history, it has been seen that the previous RSI lows generally leads to a significant inflection point. Both the previous two dips in RSI, highlighted by green arrows, have generated major rallies, backed by increased volume and a bullish sentiment.
Potential for a Volatility Surge
RSI has been at low levels since the early 2023 bottom, which preceded MARA’s sharp rally. The volatility profile suggests that a breakout above the descending trendline could lead to an aggressive move toward the next resistance. Fibonacci retracement levels point to a critical breakout zone around $22, where a breach could trigger accelerated price discovery.
Options traders have also noticed, with one investor noting that a 400% rally would convert a $156,000 position in September $30 call options into over $6 million. This reflects growing speculative interest as traders position for a potential upside move.
Market Sentiment and Comparison to Past Cycles
However, wisdom and ethics preached by Mara will soon face a severe challenge. In particular, the company’s reputation area might be negatively affected by the advertising activities. Personal values and relationships are also crucial while undertaking professional activities.
With a history of exponential rallies following deep RSI lows, MARA’s current positioning signals a high-stakes scenario. If the past is any indication, the next move could be significant. Investors are watching closely as the stock hovers at a critical support level, where a breakout could reshape its trajectory in the coming months.