
- Bitcoin’s RSI is oversold, mirroring past bottoms that led to strong rallies, hinting at a potential price recovery.
- A falling wedge pattern signals a possible breakout, but a breakdown below key support could invalidate the bullish setup.
- Moving averages act as strong support, aligning with historical trends where Bitcoin rebounds after testing key levels.
Bitcoin price action suggests a potential local low, as noted by Titan of Crypto. The Relative Strength Index (RSI) is currently in the oversold zone. Historically, such episodes have been followed by good recoveries. Price appreciation had occurred previously after RSI hit similar levels in the market.
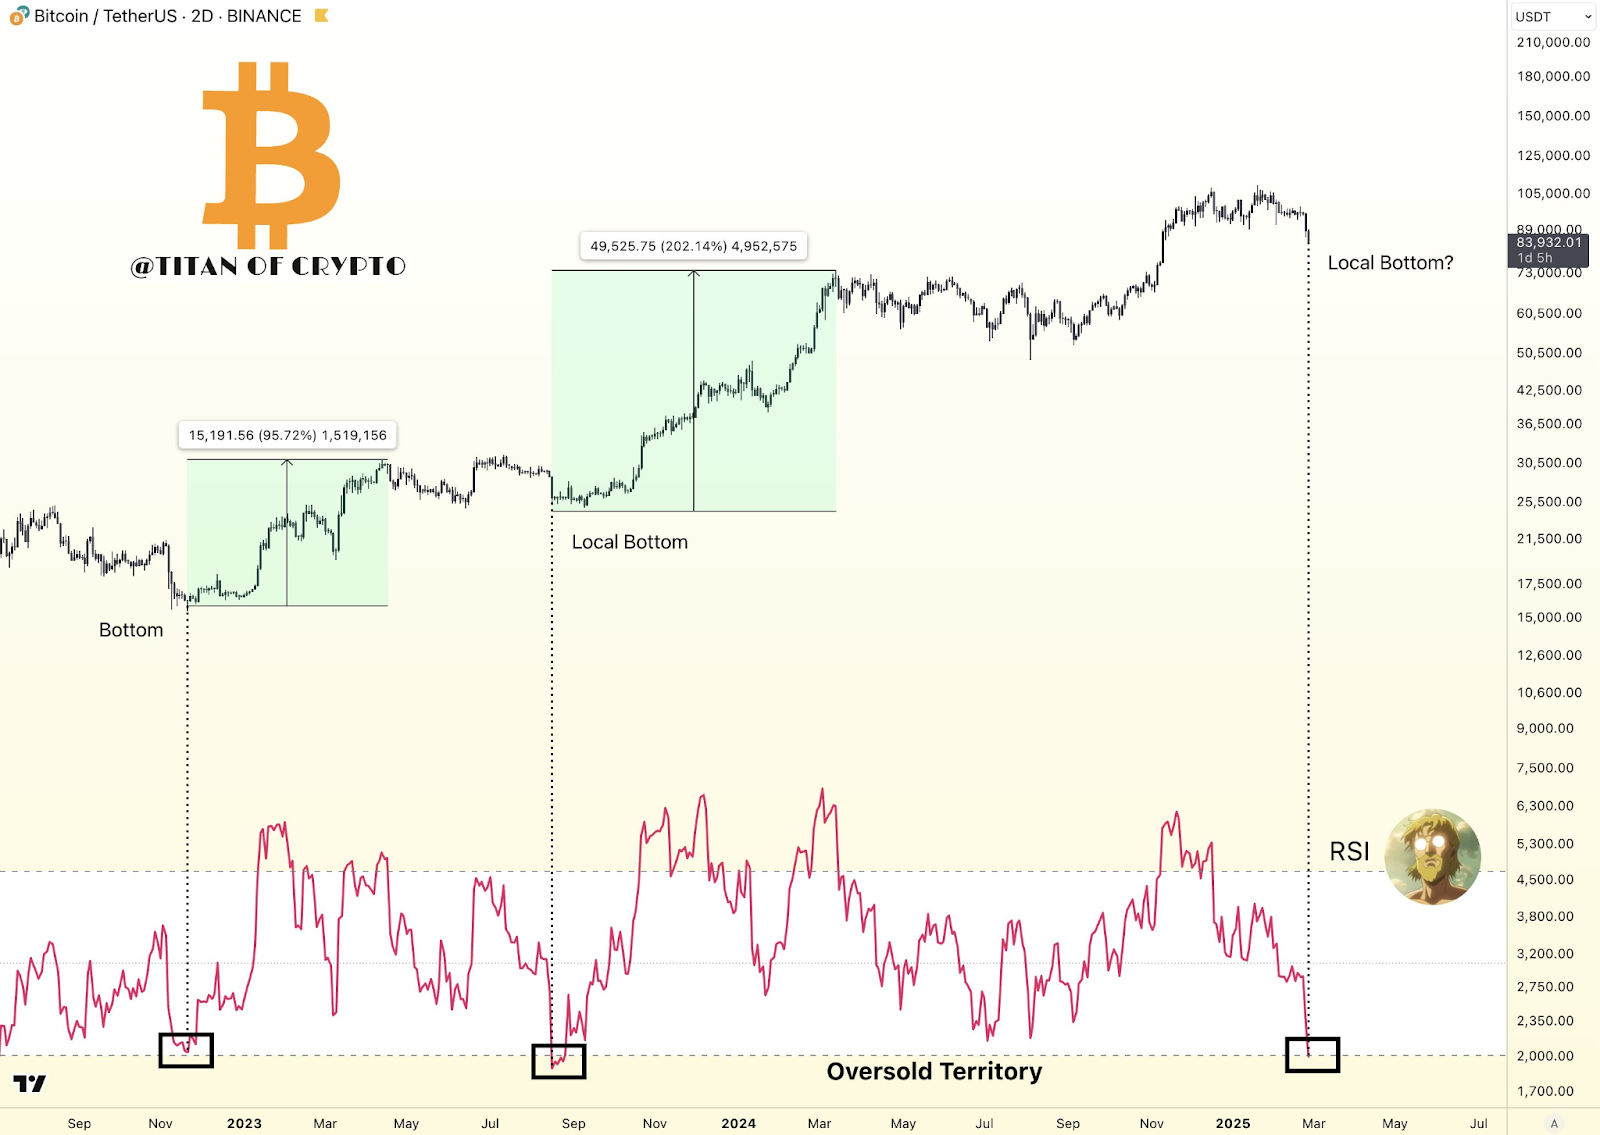
In November 2022, Bitcoin bottomed at $15,191 before surging 95.72%. RSI was in oversold territory at this point. Similarly, in September 2023, Bitcoin formed a local bottom, triggering a 202.14% rally to $49,525. Now, RSI has once again signaled oversold conditions at around $83,932. Past patterns indicate that Bitcoin may be positioning for another upward move.
Market Structure and Potential Breakout
Meanwhile, The Crypto Express highlights Bitcoin trading within a falling wedge pattern. The price is testing key support near the 100-day moving average. A decisive breakout above the pattern could confirm a bullish reversal. However, a breakdown below the support trendline would invalidate the pattern.
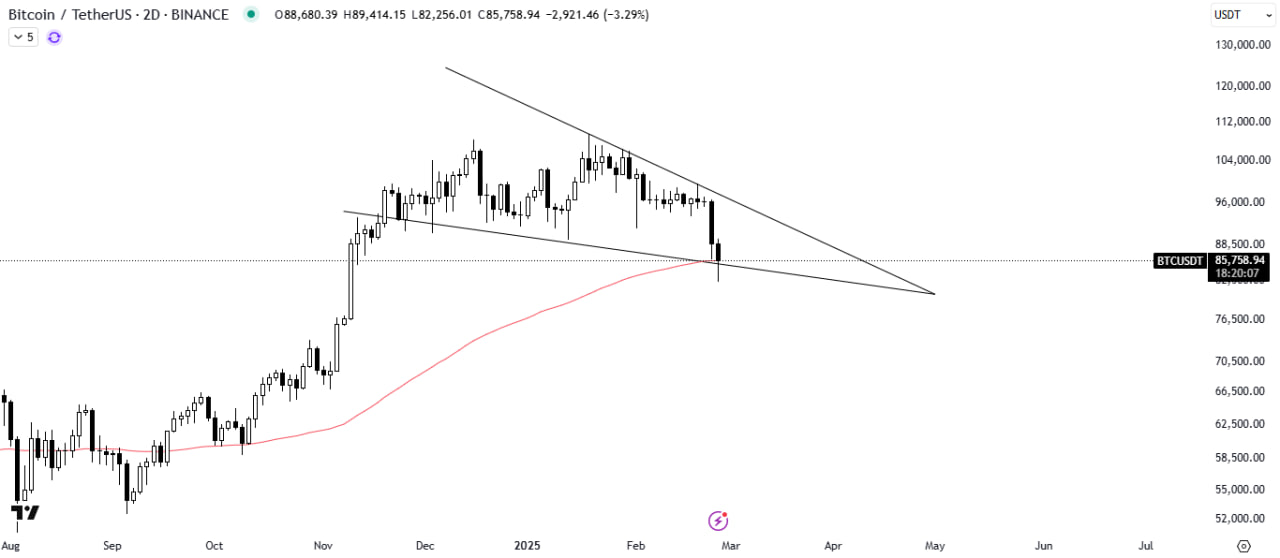
Bitcoin recently broke below a symmetrical triangle pattern, falling to $85,758, marking a 3.29% decline. The asset made lower highs and higher lows before taking out the low. The increased selling pressure drove the breakdown. Second, Bitcoin traded near $89,414 before dropping as low as $82,256, indicating increased volatility.

Moving Averages and RSI Alignment
Bitcoin’s movement aligns with historical patterns. Moving averages act as dynamic support, influencing price action. The red moving average line indicates strong support for Bitcoin, which showed a slight recovery after testing this level. In addition, the oversold condition of the RSI agrees with previous bullish reversals, thus strengthening the argument for a possible uptrend.
Moreover, Bitcoin’s historical cycles indicate that extreme RSI conditions align with strong rebounds. The past data suggests that after hitting the bottom, Bitcoin tends to enter a bullish phase. The price chart supports this, showing accumulation zones before rallies. A breakout above the falling wedge could signal a trend reversal. Conversely, if Bitcoin loses key support, further declines may follow.