

- Bitcoin faces strong resistance at $95,291.99, struggling to reclaim key Fibonacci levels, reinforcing the bearish trend.
- RSI at 28.28 signals oversold conditions, but the downtrend persists unless strong buying pressure emerges near $86,447.48.
- A relief bounce to $90K–$93K is possible, yet a retest of $86K is likely before any major reversal can take shape.
DataDash, a crypto analyst, shows Bitcoin crossing above the 0.382 Fibonacci retracement level. The price has responded as anticipated, having been at its low of $88,578.67. Bitcoin is now trading at around $88,949.99 indicating short-term selling pressure exhaustion. The trend is still bearish and could still move lower.
Bitcoin’s Key Support and Resistance Zones
The breakout from the symmetrical triangle pattern confirms a bearish continuation. Strong support exists near $87,218.40, which aligns with the 1.618 Fibonacci extension level. The price has already fallen below major retracement levels. These breakdowns signal continued selling pressure.
Resistance lies at $95,291.99, aligning with the 0.236 Fibonacci level. This area has rejected price attempts multiple times. The symmetrical triangle breakdown indicates further downside unless Bitcoin finds strong buying pressure at key support zones.
RSI and Market Sentiment Analysis
Bitcoin’s Relative Strength Index (RSI) is at 28.28, nearing an extreme oversold condition. The lowest recorded RSI level is 24.24, signaling potential relief in the near term. Despite this, bearish momentum remains strong, as the RSI downtrend continues. Historically, liquidity zones around $86,447.48 have provided support, making them crucial areas to watch.
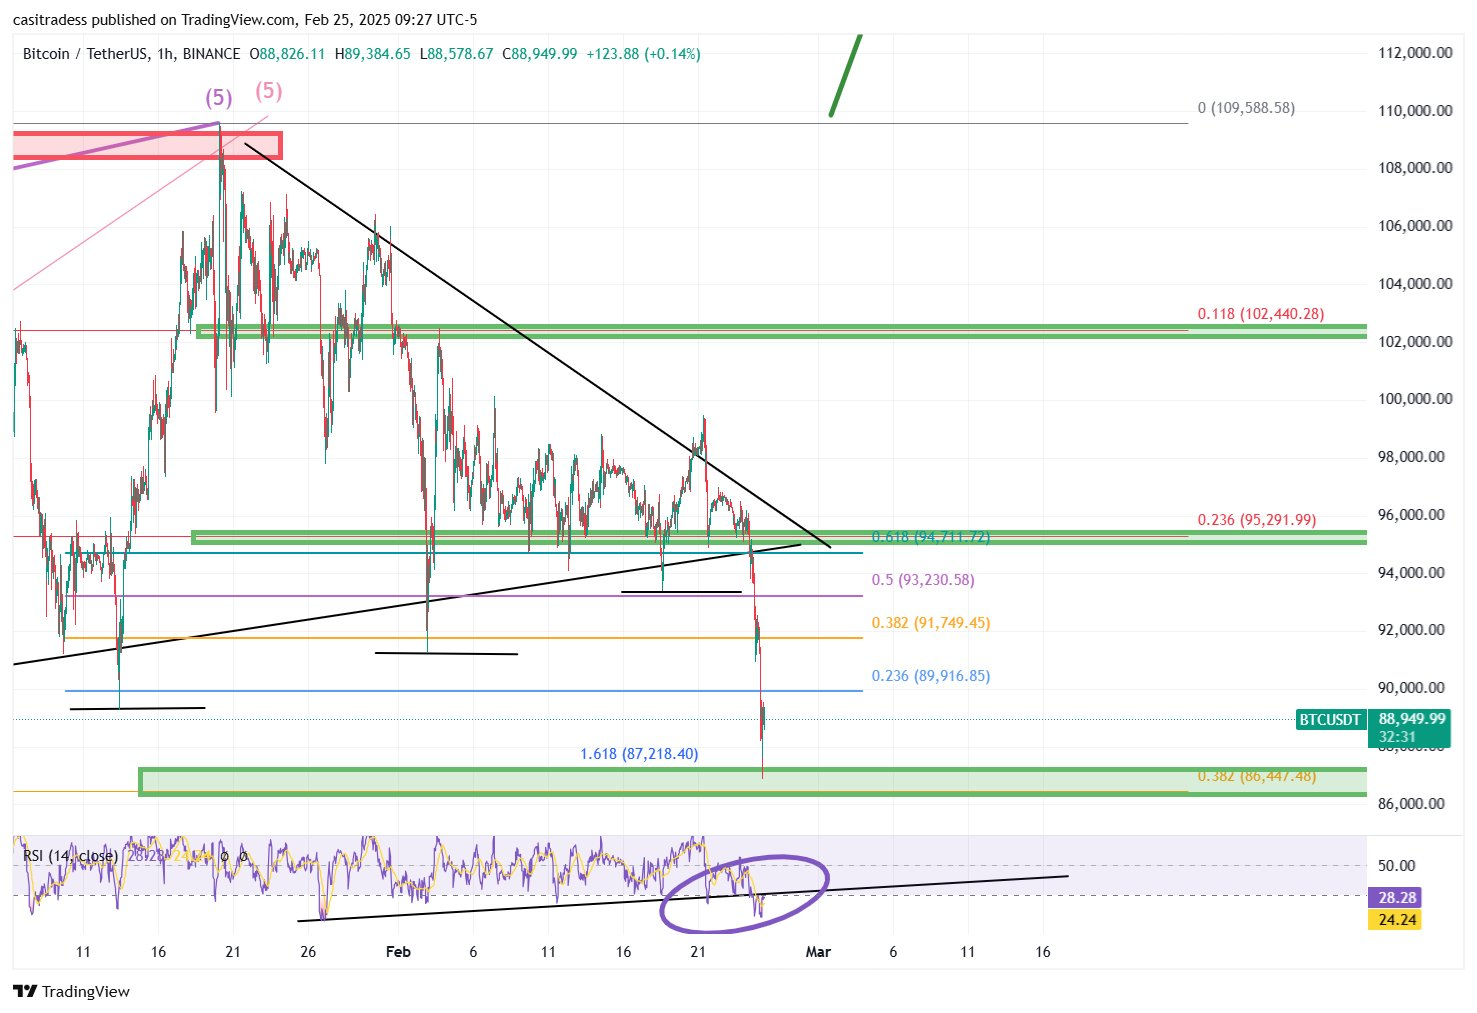
Besides, the price has failed to break above the symmetrical triangle’s upper trendline, reinforcing downward momentum. Lower highs and lower lows dominate the current trend. Unless Bitcoin reclaims higher Fibonacci levels, the bearish structure will persist.
Potential Market Movements
A short-term relief bounce is possible, with targets between $90,000 and $93,000. However, another retest of $86,000 is likely before any major reversal. Fibonacci levels act as key reaction zones where traders anticipate price movements.
Bitcoin’s previous all-time high rejection near $102,440.28 adds to existing resistance. If BTC fails to reclaim higher levels, further downside remains probable. However, if buyers step in at major support zones, a trend reversal could develop.