

- Ethereum’s double-top pattern signals bearish momentum, with the 0.618 Fibonacci level as the last major support zone.
- A breakdown below key support could trigger a sharp ETH decline, while a symmetrical triangle hints at a breakout soon.
- ETH dropped 8.45% to $2,435.55, testing critical support levels amid high market activity and volatile sentiment.
Ethereum is struggling to hold a critical support level as the market turns volatile. CryptoBusy reports Ethereum (ETH) breaking down from major support forming a double-top pattern. The 0.618 Fibonacci retracement level serves as the last line of defense.
If ETH fails to hold this level, another sharp decline may follow. The market is showing signs of weakness, making it difficult for beginners to navigate. Staying cautious amid this potential downturn is essential.
Ethereum’s Price Action and Technical Structure
Ethereum’s price movement against Tether (ETH/USDT) reveals a double-top reversal pattern. This bearish setup suggests further downside pressure. The price peaked twice at a horizontal resistance level but failed to break higher. After forming the second peak, Ethereum’s price dropped sharply, confirming the reversal pattern.
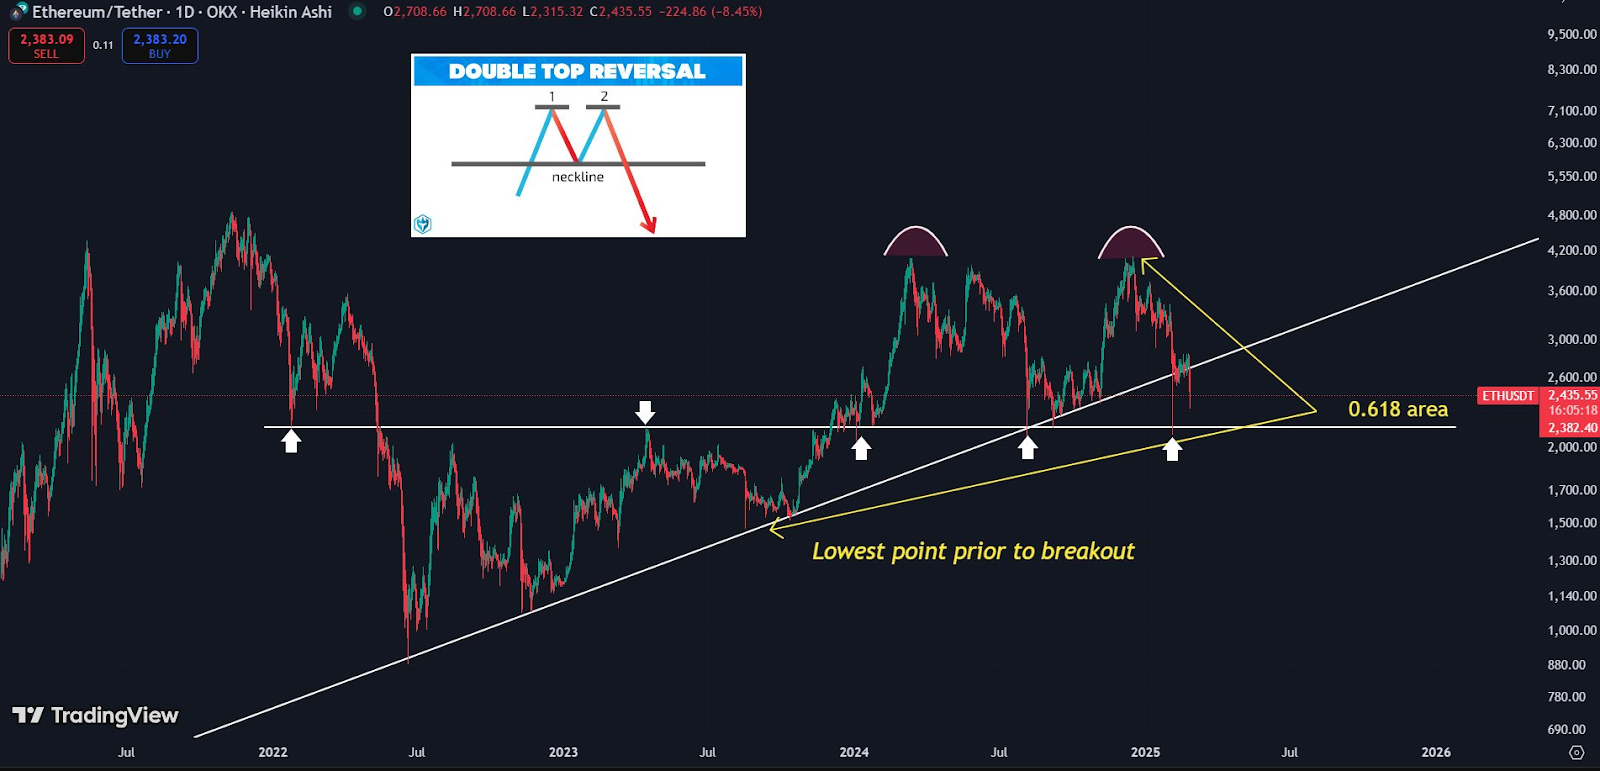
The neckline, acting as a crucial support level, has been tested multiple times. ETH also interacts with an ascending trendline, serving as dynamic support. If Ethereum closes below this level, it could trigger a further breakdown.
Key Levels and Market Sentiment
The 0.618 Fibonacci level is one that needs to be watched. ETH is at a price close to here currently, which has been an important support area in the past. There’s also a symmetrical triangle pattern, as the price action gets narrower between converging trendlines. This setup leads us to anticipate the imminent breakout either direction.
The price of Ethereum today is $2,435.55 at the time of writing, down 8.45% for the day. The high of the day was $2,708.66, and the low of the day was $2,315.32. The bid-ask spread remains tight, showing intense market activity.
Moreover, historical resistance levels have turned into support. The price has reacted to these zones multiple times, as indicated by white arrows. The lowest point before the breakout remains relevant, highlighting the prior uptrend’s starting point.