
- TRX’s breakout signals strong bullish momentum, with a potential 444% surge targeting $1.11 based on past price action.
- Short-term resistance at $0.26189 may trigger a pullback to $0.22532, aligning with past consolidation zones.
- Fibonacci extensions and measured moves support TRX’s long-term bullish outlook, despite short-term selling pressure.
Javon Marks has recently offered a sharp technical breakdown of TRON (TRX) showing a t price breakout. TRX has maintained high bullish pressure following the breakout and is on track to record further gains. The price action points towards a potential move to the $1.11 level, which represents an additional 444% gain.
Bullish Breakout and Symmetrical Triangle Formation
TRX previously surged 714.19% before entering a symmetrical triangle consolidation phase. This pattern reflected market indecision, with price movement narrowing over time. However, there was a breakout, which raised both the highs and lows. As a result, the breakout verified that the rising trend would continue.
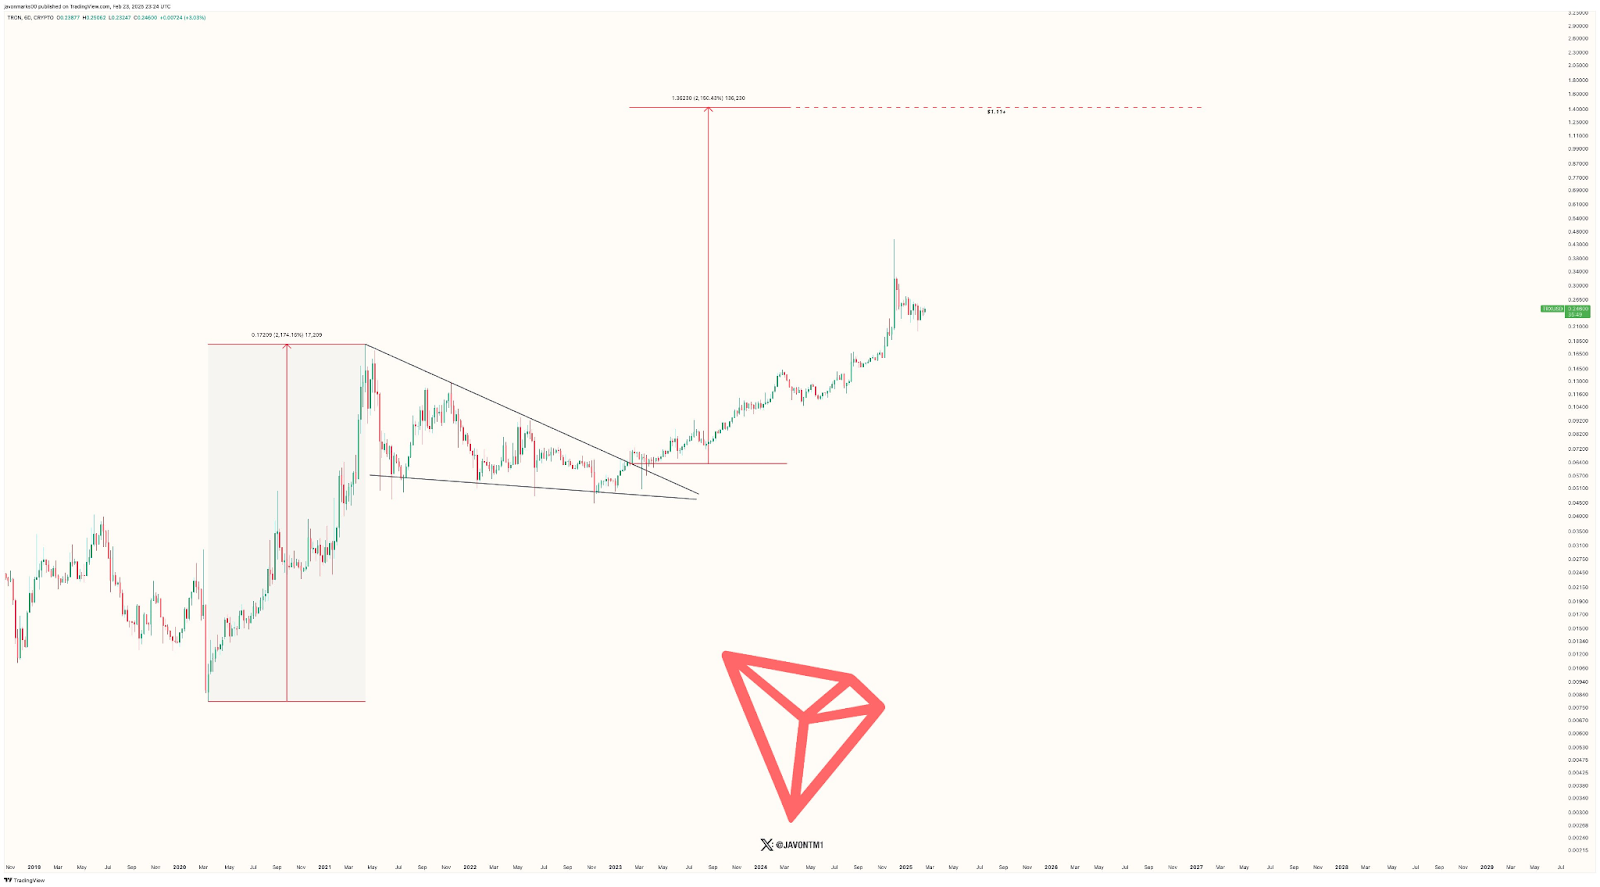
Besides, a measured move projection from the prior rally suggests a possible long-term price target. The Fibonacci extension level further validates this price projection. The chart also reveals a red dashed line, indicating a resistance level that aligns with this prediction. Moreover, TRX is trading above previous consolidation zones, reinforcing the strong bullish sentiment.
Short-Term Resistance and Potential Pullback
TRX is currently trading near $0.24754 and approaching a key resistance zone around $0.26189. This level has previously led to price rejections, making it a crucial area to watch. Additionally, multiple wicks above the resistance level suggest significant selling pressure. A measured move projection above this zone points to a 3.39% potential upside before a possible reversal.
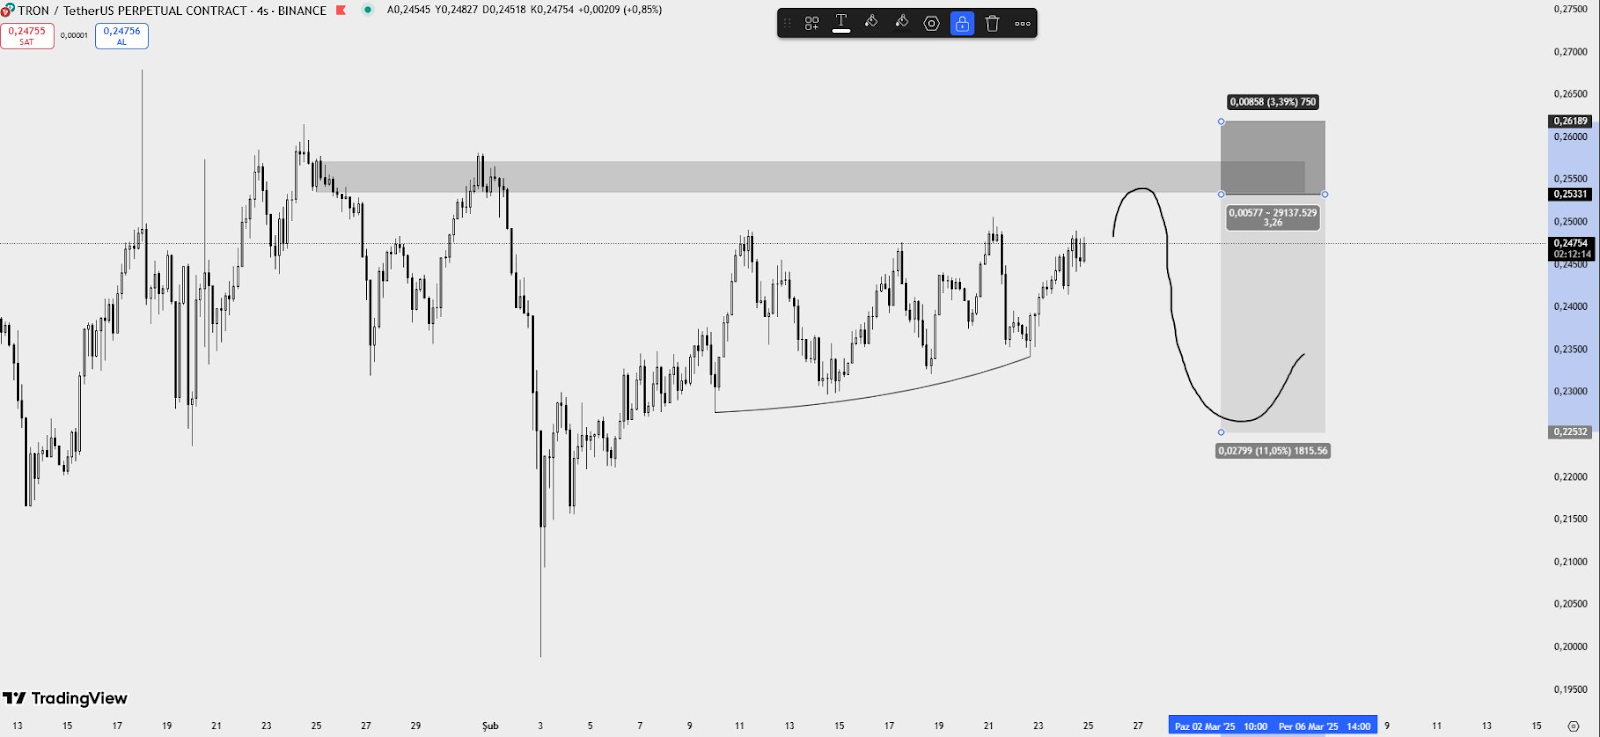
However, a downward move could follow, as indicated by a black curved line. The projected decline of 11.05% could bring TRX to the $0.22532 level. This aligns with historical consolidation areas, making it a potential demand zone. Furthermore, price action suggests strong liquidity at these levels.