
- Solana faces strong resistance, with bulls needing a breakout to spark a rally, while failure could lead to further declines.
- The ascending triangle signals bullish potential, but rejection at $236.46 highlights sellers’ strength at key levels.
- Holding trendline support is crucial—losing it could shift momentum to bears, while a breakout may drive prices higher.
Captain Faibik has highlighted the resistance level for Solana ($SOL) on the monthly chart. The price struggles against a horizontal barrier that has repeatedly halted upward momentum. If buyers push past this level, a strong rally could unfold. Faibik predicts Solana could reach $1,000 in the next bullish cycle. However, current price action suggests a battle between bulls and bears at a critical point.
Solana’s Ascending Triangle Signals Potential Breakout
Solana’s price movement forms an ascending triangle pattern, often considered bullish. A horizontal resistance line has repeatedly rejected price attempts to move higher. Below, a rising trendline connects higher lows, showing consistent buying pressure.
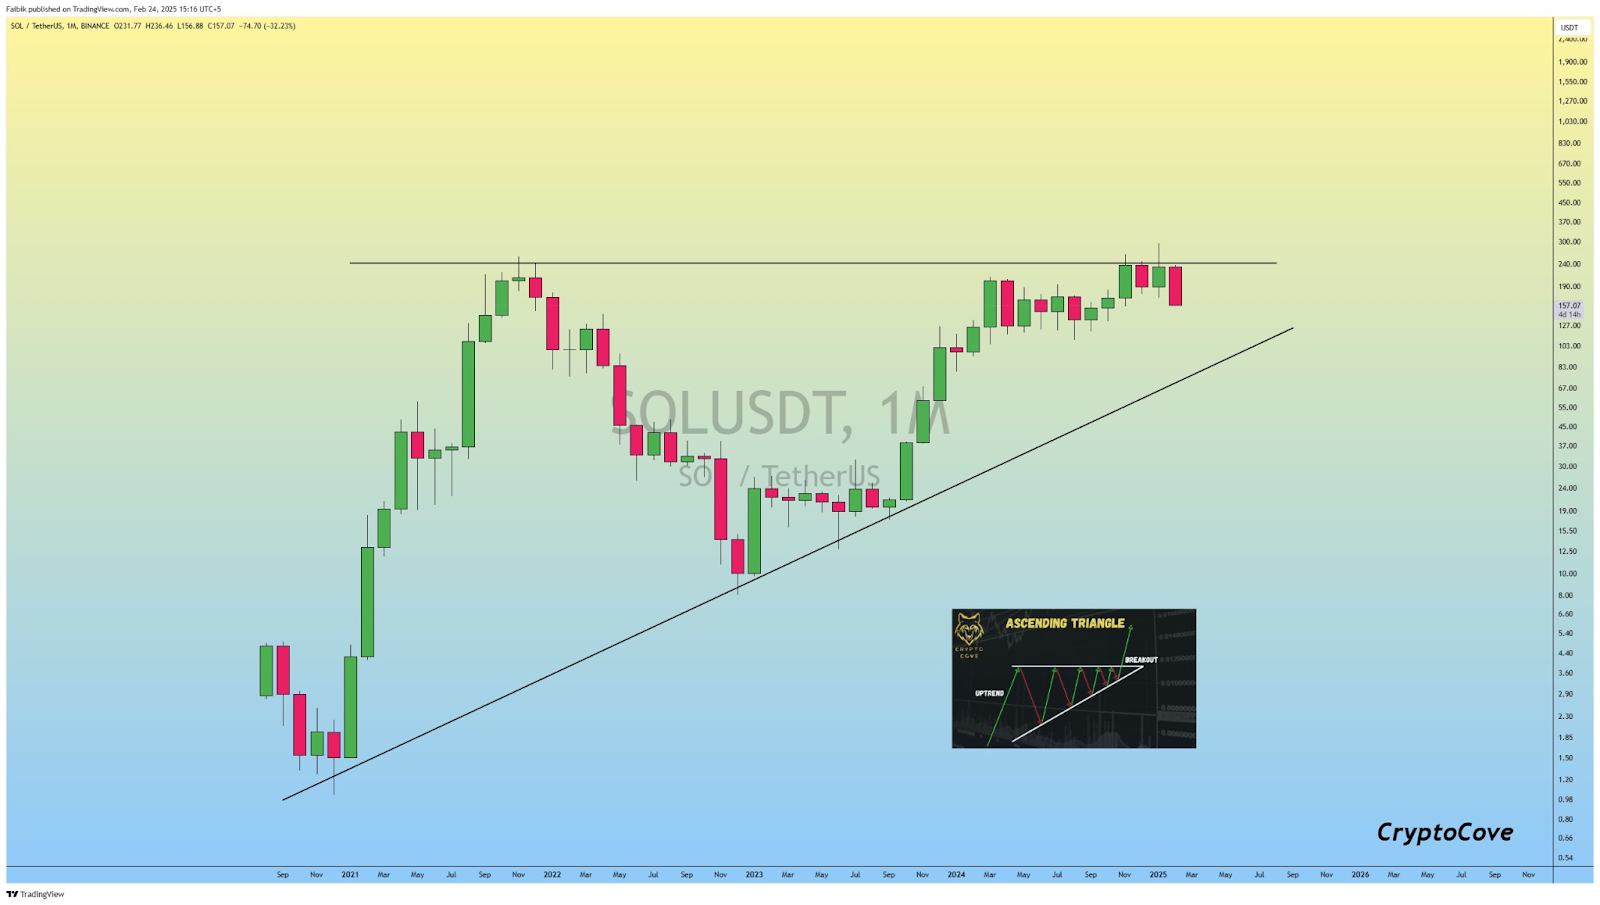
Solana experienced a rapid rise in late 2020, followed by strong volatility. It reached an all-time high in 2021 before declining and consolidating. Over time, the ascending triangle developed, indicating accumulation.
In recent history, the price got to $236.46 before it reversed. The rejection from resistance made it dip, with SOL trading at approximately $157.07 now. This is a $24.70 loss (-13.23%) in the latest trading session, which suggests increased selling pressure.
Despite this rejection, the bullish trend remains intact if SOL holds above the ascending trendline. If the price consolidates within the pattern, it may attempt another breakout. However, losing trendline support could trigger a downward move.
Market Sentiment and Future Price Movement
The trend for Solana remains bullish as long as it maintains support. A breakout above resistance would confirm strong momentum, potentially leading to new highs. Failure to hold above the trendline could lead to lower price levels. If support fails, bears may regain control, pushing prices downward. The market now awaits confirmation of the next major move.
The ascending triangle remains a key technical structure. Historical price action suggests that strong breakouts can occur once resistance clears. Given increasing buying pressure, traders watch for signals of a decisive breakout.