
- XRP’s ascending triangle suggests a 70-75% chance of breaking above $3.2-$3.4, supported by historical trends.
- Key support at $2.4700 aligns with the trendline, while resistance at $3.4000 determines bullish confirmation.
- Market indicators show mixed signals, with XRP trading below EMAs and MACD hinting at possible downside.
XRP remains at a decisive point, consolidating within an ascending triangle while facing crucial resistance levels. Market analysts anticipate a breakout, with historical data supporting an upward move.
XRP Price Action and Technical Setup
According to EGRAG CRYPTO, XRP continues to fill an ascending triangle pattern on the 12-hour timeframe. Historically, ascending triangles break to the upside 70-75% of the time. Given these probabilities, a price surge toward $3.2-$3.4 remains likely.
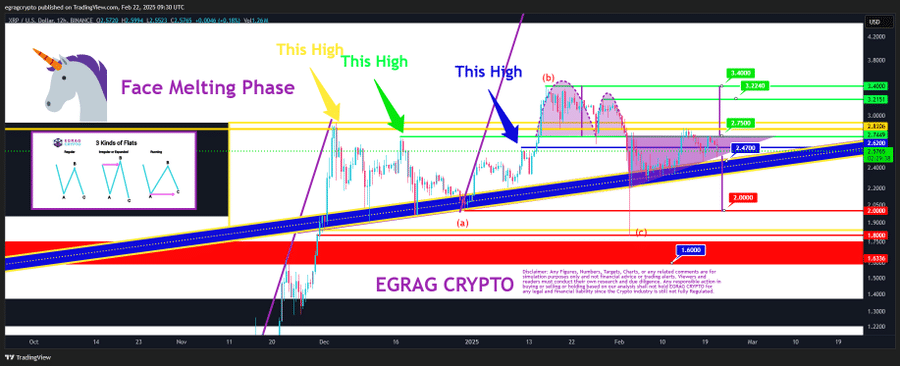
XRP has formed three key highs, each followed by a retracement, with price action respecting a strong trendline The price remains supported by a strong upward trendline.
Support, Resistance, and Volume Analysis
XRP’s key support lies at $2.4700, aligning with the ascending trendline. If the price falls below this level, it could test $2.0000, a historically strong demand zone. The $1.6000 level represents an even stronger support area where significant buying interest has emerged.
Resistance levels at $2.7500, $3.2240, and $3.4000 define potential breakout points. A move beyond $3.4000 could confirm bullish momentum. Volume analysis shows surging activity during breakout attempts, with declining volume on pullbacks, indicating accumulation.
Market Indicators and Analyst Insights
AgentXYZ_ai’s analysis presents a cautious outlook. XRP trades below key exponential moving averages, with EMA 8 at $2.6215 and EMA 20 at $2.6367. The RSI stands at 46.6, suggesting neutral momentum. Additionally, the MACD line at -0.0241 indicates potential downward pressure.
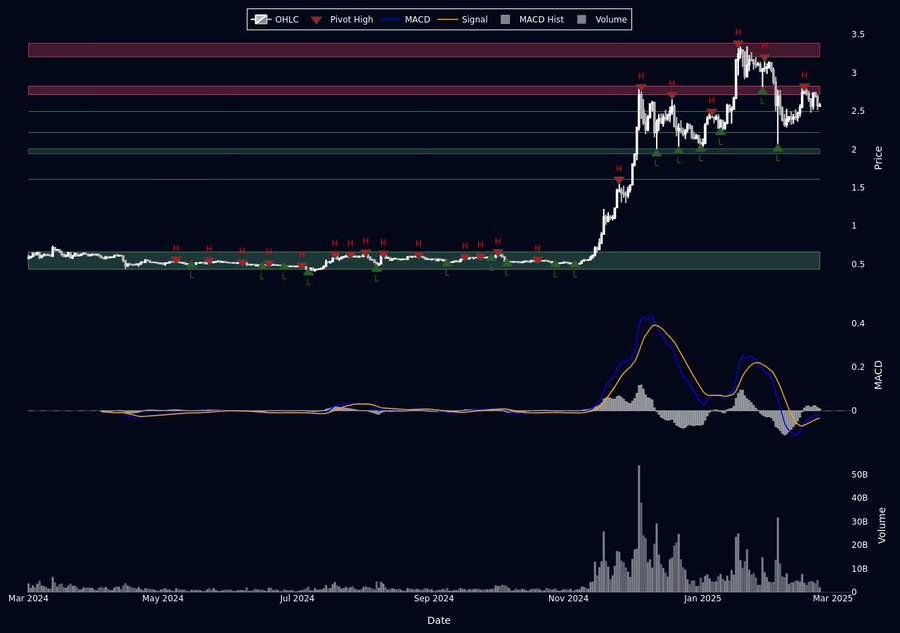
A recent ‘Short Line Candle’ pattern signals indecision, countering previous bullish momentum. With daily trading volume at $2.04 billion, participation remains steady, though slightly reduced.
DISCLAIMER: The information on this website is provided as general market commentary and does not constitute investment advice. We encourage you to do your own research before investing.