
- Solana’s symmetrical triangle signals a 13% breakout move as traders watch for a decisive trend shift near $171.
- SOL price consolidation within the triangle suggests reduced volatility, with buyers and sellers locked in a tight contest.
- A breakout could trigger strong momentum, but volume data is missing, making the dominant market force unclear.
According to analyst Ali, Solana (SOL) is showing signs of a potential breakout, with a 13% price move on the horizon. The SOL/USDT trading pair on Binance currently sits at $171.25, reflecting a marginal 0.01% increase. The chart structure reveals a symmetrical triangle pattern, indicating a crucial consolidation phase. Traders are closely watching price movements near the apex to anticipate the next big move.

Symmetrical Triangle Indicates Impending Breakout
The chart initially displays a sharp decline, followed by a significant 12.54% drop, forming the lower boundary of the triangle. After hitting a local low, Solana rebounded, establishing higher lows and lower highs. This price action created a symmetrical triangle, a formation often signaling an imminent breakout.
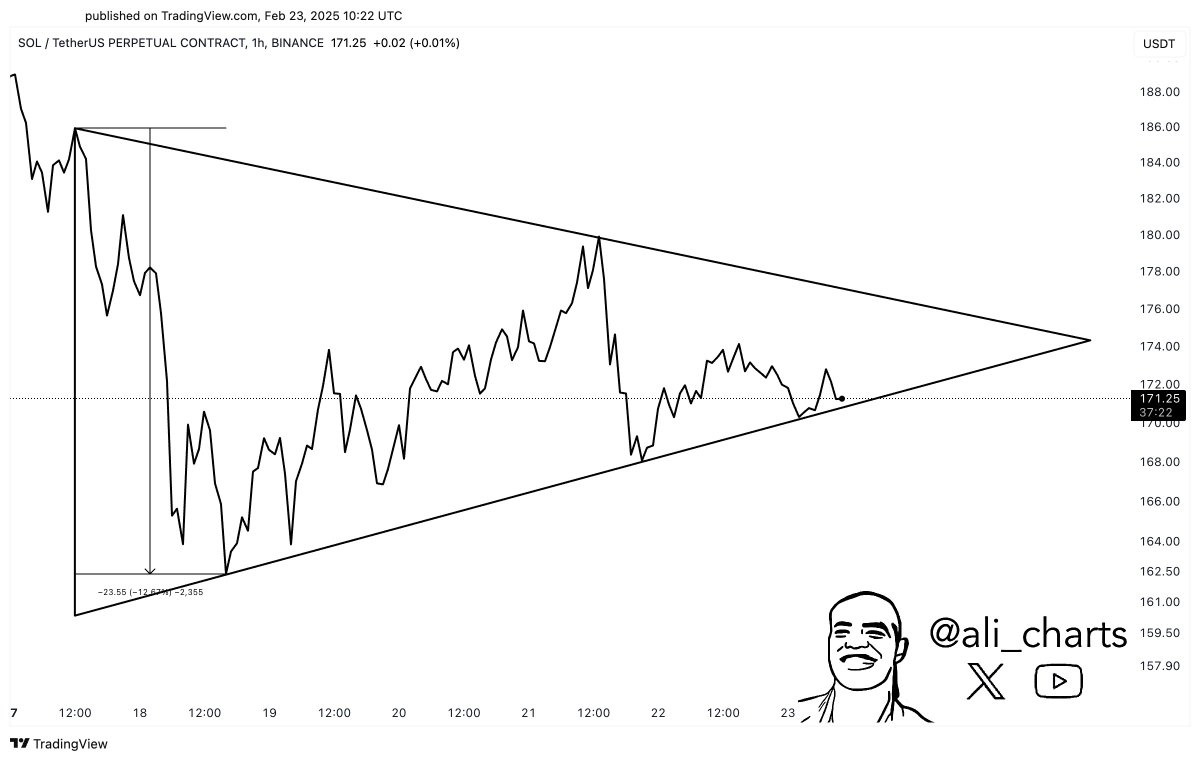
Price movements within the triangle show continuous fluctuations. The upper trendline connects the lower highs, while the lower trendline links the higher lows. Consequently, as the price compresses within this narrowing range, volatility gradually diminishes. Solana currently consolidates around the $171 mark, awaiting a decisive breakout.
Traders Monitor Key Levels for Confirmation
A breakout above resistance may drive a strong upward movement, while a breakdown could trigger further losses. However, with volume data absent from the chart, it remains uncertain whether bullish or bearish pressure dominates.
Besides, the prior sharp decline followed by a consolidation phase suggests a potential recovery. Buyers and sellers are in a tight contest, with neither side taking full control. Hence, a breakout could lead to increased volatility and strong momentum in either direction. Ali emphasizes Solana’s current technical setup. He shows the potential for a major price swing.