
- Bitcoin rebounded from key Fibonacci support after a sharp drop triggered by the Bybit hack, signaling strong buyer interest.
- Market uncertainty lingers as Bitcoin tests the 0.618 retracement, with $95,000 acting as a crucial level for bullish continuation.
- Sellers remain active at resistance, while buyers defend support, making Bitcoin’s next move critical for short-term trend direction.
CryptoBullet shows Bitcoin testing the critical 0.618-0.786 Fibonacci retracement levels on the 4-hour data. The market reacted sharply to news of a Bybit security breach, sparking a rapid price drop. However, analysts believe the reaction is exaggerated since Bybit remains solvent with $16 billion in reserves.
Bitcoin’s Price Action Shows Key Support Retest
Bitcoin has been in a downtrend before consolidating near crucial support. A descending trendline formed, marking lower highs. Eventually, a breakout followed, leading to a 3.52% gain. However, resistance at $98,757 halted further upside momentum.
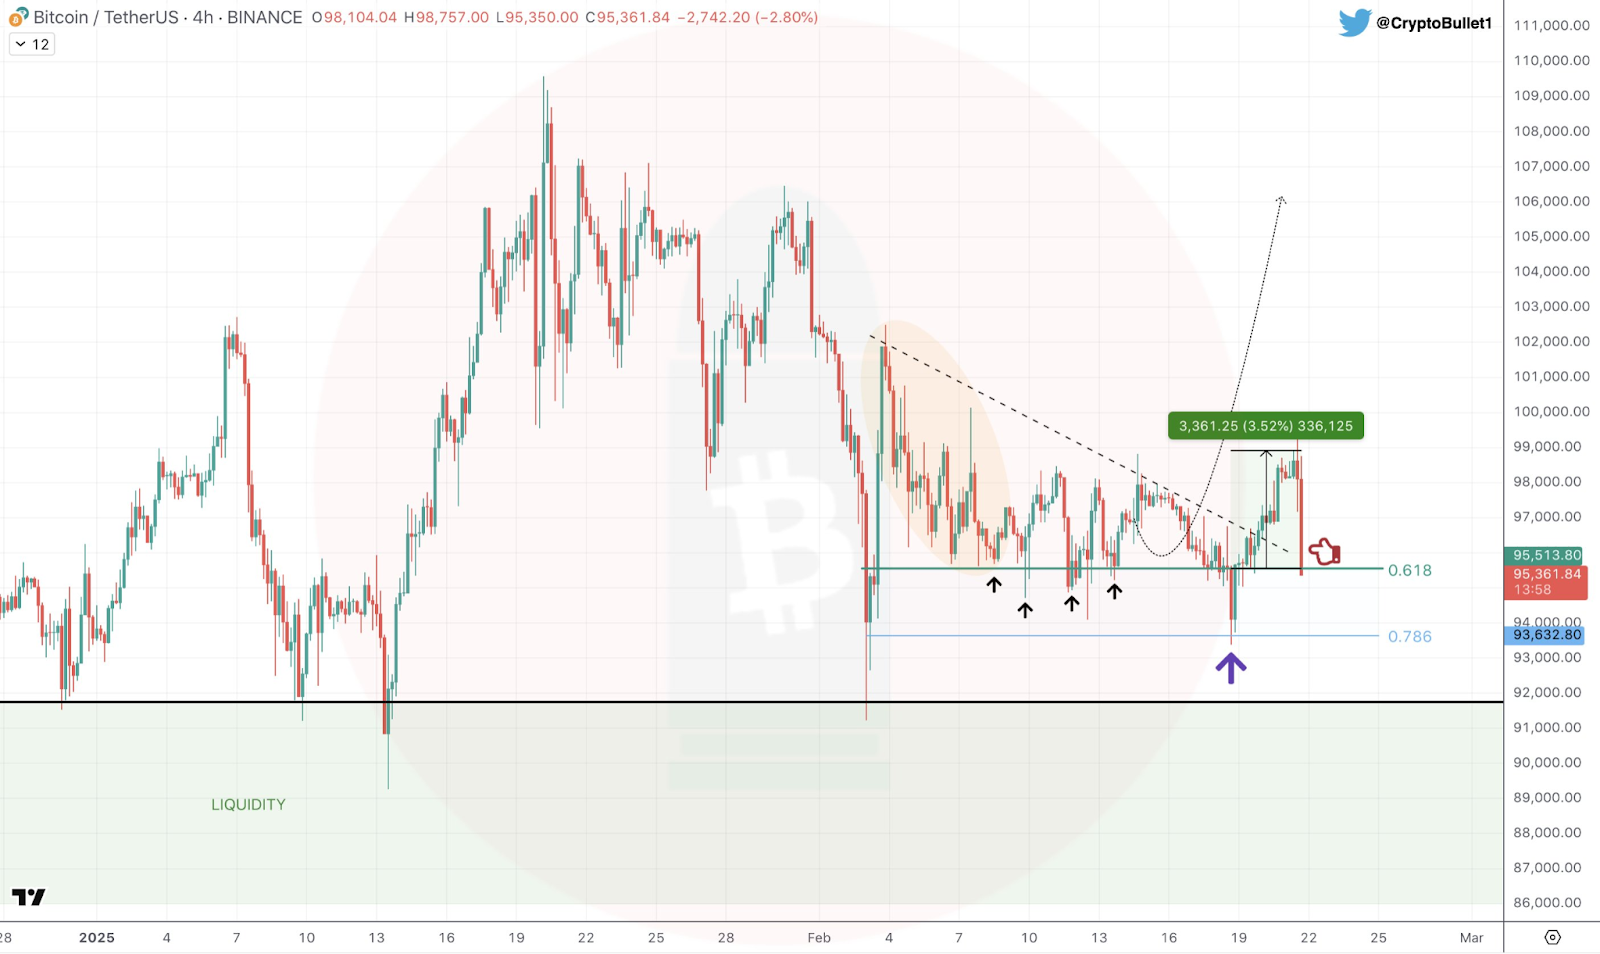
The recent sharp move downward tested the 0.786 Fibonacci level near $93,632.80 before buyers stepped in, triggering a rebound. A strong buying reaction followed, confirming demand at this level. Besides, price action continues to respect key Fibonacci levels, dictating support and resistance zones.
Market Volatility and Future Projections
The latest pullback brought Bitcoin back to the 0.618 retracement level. A bearish reaction emerged, signaling uncertainty in the market direction. Bitcoin has to hold above $95,000 to maintain its bullish structure. Failure to do so could drive prices toward the previous liquidity zone near $94,000.
Moreover, Fibonacci levels play a crucial role in Bitcoin’s price action. Sellers remain active at resistance points, while buyers defend support zones. If Bitcoin reclaims its local high, an extended rally may follow. However, another failure at resistance could spark further downside movement.

Market Structure and Trading Behavior
Candlestick formations reveal a mix of bullish and bearish reactions. Besides, long wicks indicate strong price rejections at key levels. Bitcoin’s next move could determine the short-term trend with the absence of volume data making it difficult to gauge market strength. However, price action alone suggests participation at critical levels.
Additionally, the market remains reactive to Fibonacci’s support and resistance. Buyers and sellers continue battling for control. Hence, Bitcoin’s ability to sustain support could signal the next major price movement.