
- LINK’s breakout from a descending channel signals a bullish trend shift, with strong support at the $15-$16 demand zone.
- Resistance at $32.70 and $45.41 are key upside targets, with price action suggesting a potential double-leg move higher.
- Holding above the 0.618-0.786 Fibonacci levels supports a 70%-140% rally, but losing the $15-$16 range risks a bearish reversal.
Chainlink (LINK) is showing strong bullish momentum, breaking out from a prolonged downtrend. Analyst Rose notes key technical patterns supporting a potential long term uptrend. At press time, LINK was trading at $18.97, a 0.20% daily increase.

The price recently tested a critical Fibonacci level before rebounding, indicating strong support. With higher lows forming and accumulation complete, a breakout could push LINK toward key targets of $32.70 and $45.41. However, maintaining support within the $15-$16 range is crucial for sustained bullish momentum.
Breakout Confirms Shift
LINK has broken out of a descending channel, shifting the trend from bearish to bullish. The daily price has traded between a high of $19.84 and a low of $17.64. The recent breakout aligns with market pattern shift, indicating potential for further upside.
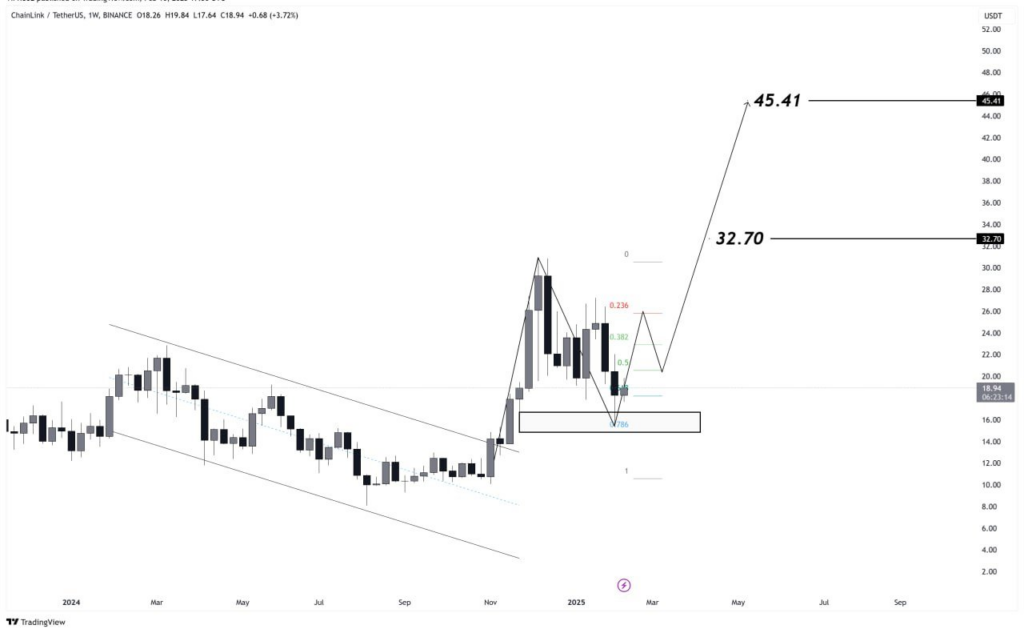
The $15-$16 demand zone is a key support level, aligning with the 0.786 Fibonacci retracement. Holding above this range supports the bullish sentiment. Price has respected key Fibonacci levels, strengthening the outlook for continued gains. A failure to maintain this support could lead to renewed bearish pressure and possible range bound movement.
Resistance Levels and Bullish Predictions
LINK resistance is at $32.70, which is the first upside target. If buying momentum continues, the next extended target is $45.41. The current pattern suggests a double leg move, potentially pushing the price towards these levels.
The breakout indicates an increasing demand for LINK, as accumulation is complete. If buyers sustain control, the next leg up could push LINK toward these targets. However, if price struggles to break these resistance levels, consolidation may occur before another attempt at an upward move.
Bullish Indicators and Potential Risks
The breakout from a descending trend suggests an end to the prolonged bearish cycle. Holding above key Fib levels, especially between 0.618 and 0.786, supports the case for further gains. Predictions suggest a 70% to 140% rally, dependent on sustained bullish momentum.
Despite the optimistic outlook, risks remain. A breakdown below the $15-$16 range could invalidate the bullish outlook, pushing LINK back into a downtrend. Failure to maintain key levels may lead to price consolidation rather than an immediate breakout.