- FTX Token’s breakout from a descending wedge suggests bullish momentum, with targets at $3.28, $4.02, and $4.77 if buying pressure holds.
- Analysts predict a potential 154% surge in FTT price, pushing it toward $5.80 or beyond if resistance at $4 is breached.
- Failure to hold the $2 support could weaken the bullish outlook, leading to a possible retest of lower levels around $1.20.
FTX Token (FTT) has had a strong bullish pattern, breaking out of a descending wedge. Analysts predict a potential upward move if momentum continues. According to Rose, FTT has been consolidating inside this wedge and is now attempting a breakout.
Resistance levels are at $3.2898 in the short term, $4.0280 in the mid term, and $4.7796 for a full breakout. A successful retest of the wedge could push the price toward these levels. The market pattern shows that FTT broke out of a symmetrical triangle, suggesting a shift from a prolonged bearish phase.
If buying pressure increases, FTT may rally toward key resistance areas. However, failure to hold momentum could result in a pullback toward the $2-$2.20 range before another breakout attempt.
Support and Resistance
FTT’s immediate support is at $2-$2.20, which was a previous consolidation area. This level is essential to maintain for a bullish movement. The primary resistance zones are $3.2898, $4.0280, and $4.7796, showing essential upside targets.
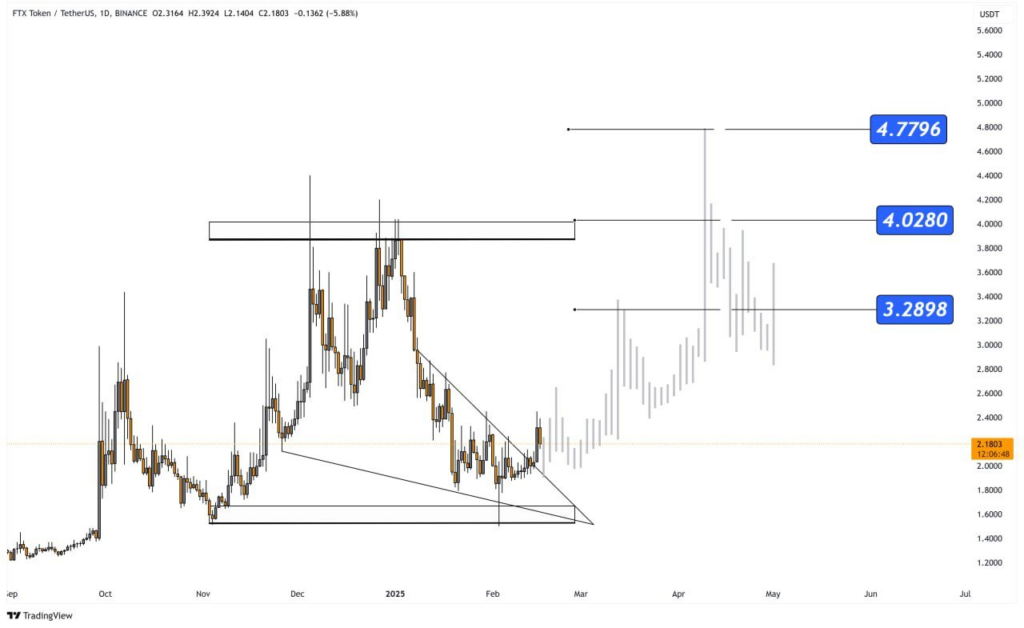
A black resistance zone on the chart is a strong supply area where FTT previously faced heavy selling pressure. If FTT successfully breaks above this area, it could push toward higher levels.
According to analyst Javon Marks, FTT is forming higher lows, suggesting a potential for more upside. A breakout beyond $4 could push prices toward $8-$10. However, if support at $2 fails, it could lead to a drop toward $1.50 or lower.
Market Indicators Show Bullish Strength
Technical indicators suggest increasing bullish momentum. The descending wedge breakout is typically a bullish reversal pattern, indicating that selling pressure is fading. Analysts see a potential 154% increase in price, which could take FTT toward $5.80 or beyond.
Higher lows and higher highs indicate strong accumulation. The market pattern remains bullish as long as FTT maintains support levels. A push above $4 could confirm further upward movement. Increased volatility suggests growing investor interest.
If FTT maintains its higher low pattern, it could challenge key resistance at $4 and extend gains toward $8. However, a failure to hold above $2 may weaken the bullish outlook, leading to a possible retest of lower support levels around $1.20.
Disclaimer and Risk Warning
Disclaimer: Any information written in this press release does not constitute investment advice. Crypto Front News does not, and will not endorse any information about any company or individual on this page. Readers are encouraged to do their own research and base any actions on their own findings, not on any content written in this press release. Crypto Front News is and will not be responsible for any damage or loss caused directly or indirectly by the use of any content, product, or service mentioned in this press release. For more details, visit our disclaimer page.