
- Bitcoin has moved past its old limit and is now showing strong signs of heading to a much higher price.
- The trend suggests Bitcoin may soon reach new highs as it follows past patterns that led to big jumps.
- Traders are watching closely as Bitcoin nears a breakout that could take it to the next major price target.
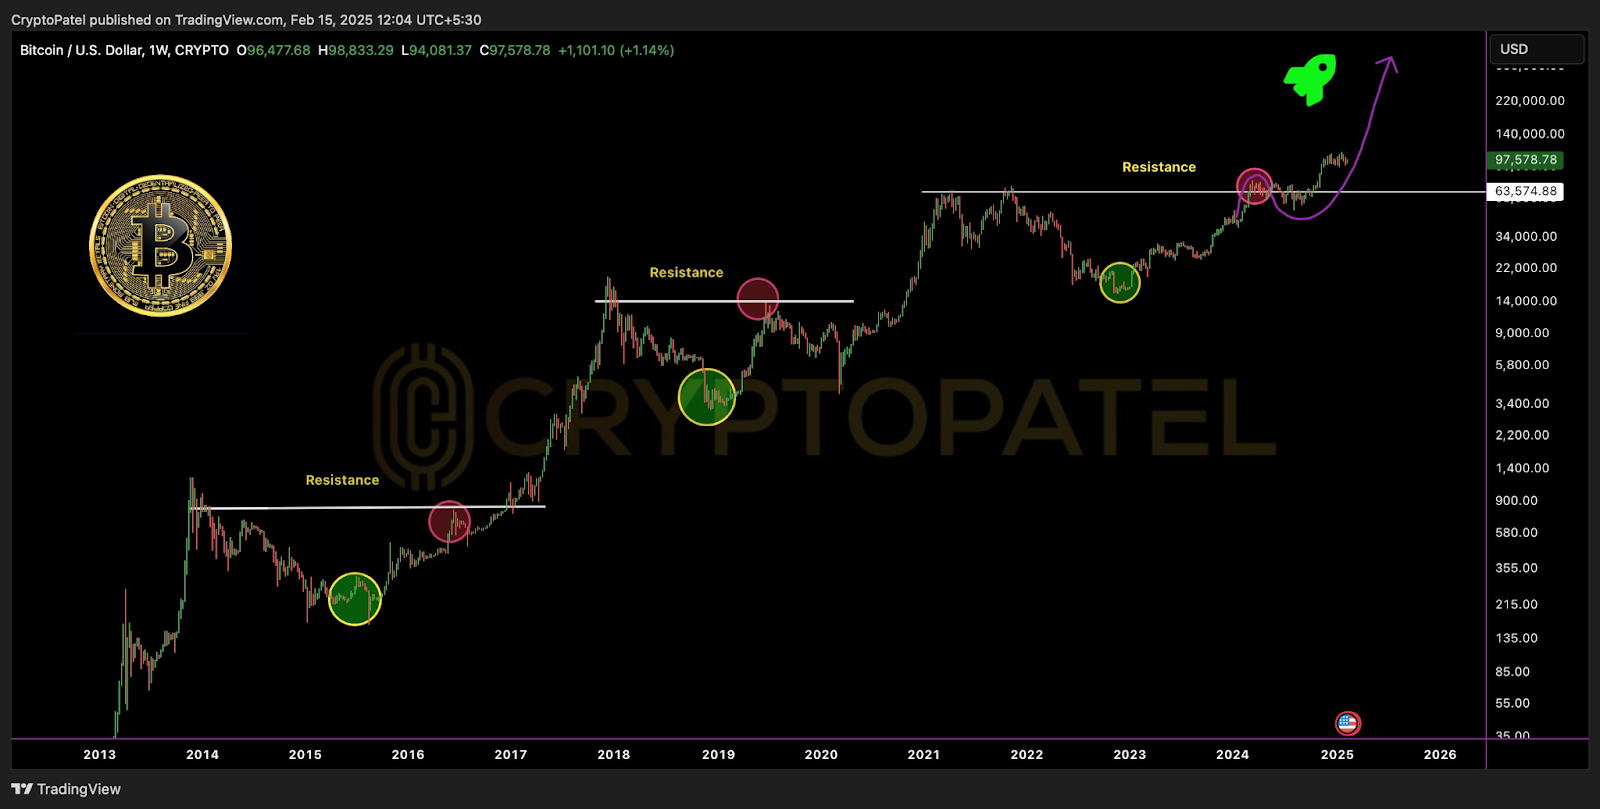
Bitcoin (BTC) is once again in the spotlight as analyst Crypto Patel highlights a historical pattern that suggests a massive rally could be on the horizon. The latest chart analysis shows BTC trading at $97,578, up 1.14% in the last session. This rally follows a breakout above a resistance level at $63,574, which previously acted as a rejection point in past cycles.

The chart reveals a multi-year trend, where Bitcoin has turned old resistance levels into support before embarking on new bull runs. With price action aligning perfectly with past breakouts, the market could be setting up for another price discovery phase.
Bitcoin’s Historical Resistance Flips and Market Cycles
In past cycles, Bitcoin has repeatedly faced major resistance before experiencing runs. The chart marks three distinct resistance points, each followed by an explosive rally. In 2017, BTC struggled at $1,200, but it surged past $19,000 once it broke out. Similarly, in 2020, Bitcoin faced resistance at $19,000, yet it quickly soared beyond $69,000 after breaking through. The same pattern seems to unfold now, with BTC overcoming resistance near $63,574, setting the stage for a move toward six-figure territory.
The yellow circles on the chart highlight key accumulation zones, where Bitcoin found support before its next move up. The red circles indicate past resistance levels that rejected price advances but later turned into support zones. Following this pattern, BTC is now retesting its most recent breakout zone, potentially gearing up for the next phase of its rally. If history repeats, Bitcoin could soon challenge $150,000–$200,000 levels.
Bitcoin’s Next Price Targets: How High Can BTC Go?
Crypto Patel’s chart suggests Bitcoin may be following a classic breakout pattern, where previous resistance zones act as springboards for the next rally. The next upside target, based on historical Fibonacci projections, could be in the range of $150,000 to $220,000. The purple curved line on the chart hints at a steep parabolic move, a pattern similar to previous bull markets.
A weekly close above $100,000 could confirm this trajectory, signaling the start of another powerful uptrend. The rocket emoji on the chart suggests what many traders are hoping for—a full-throttle rally into uncharted territory.
Final Thoughts: Exit Strategy or Ride the Wave?
Crypto Patel’s post asks an important question—”What is your Bitcoin exit point?” With BTC now eyeing six-figure prices, many traders are debating whether to take profits or hold for the next leg up. The 4,790 views and high engagement on the post reflect the excitement around Bitcoin’s next move.
While short-term dips remain possible, the bigger picture suggests that Bitcoin is following a historical cycle that has led to massive gains. If past trends hold, Bitcoin may soon rewrite the history books once again. For now, all eyes are on BTC’s next resistance zone, as traders prepare for what could be one of the biggest moves in Bitcoin’s history.