- Over $2.3B in shorts are stacked between $117K–$120K; a breakout could lead to a major short squeeze.
- RSI and MACD show weakening momentum, suggesting possible consolidation despite bullish structural setup.
- Long leverage has been unwound below $116K, reducing downside pressure while shorts above $120K raise upside risk.
Bitcoin is just below a key resistance zone, with over $2.3 billion in short positions stacked between $117,000 and $120,000. The digital asset is trading at $118,267.44, a modest daily gain of 0.41%.

According to Rekt Fencer, a surge above this price band could lead to a powerful short squeeze. Data shows a growing concentration of shorts, especially across Bybit, Binance, and OKX, while long-side leverage has been heavily unwound below $116,000.
Shorts Stack Up as Bulls Deleverage Below Resistance
A steep buildup of short positions has been identified just above Bitcoin’s current level. Clusters of liquidation volume between $117,000 and $120,668 show that many traders expect a reversal. These positions, however, are now at risk. Data indicates the highest liquidation volumes are concentrated on Bybit, followed by Binance and OKX.
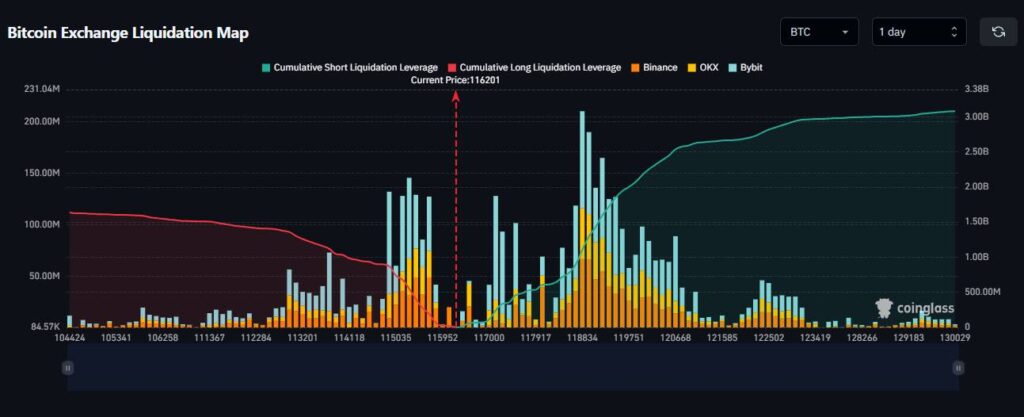
At the same time, cumulative short liquidation leverage has spiked, surpassing $3 billion above the $116,000 mark. In contrast, the cumulative long liquidation leverage has steadily dropped from around $100 million to near zero, reflecting a major reduction in leveraged bullish bets.
This divergence reduces downward pressure, while short liquidations continue to pile up. The resulting imbalance introduces a strong upside risk, especially if prices break above the high concentration zone.
Technical Indicators Show Diminishing Momentum
Despite the bullish structural setup, indicators point to a slowdown in momentum. The RSI now reads 59.10, which is below its moving average of 62.23. This decline suggests that bullish momentum is cooling, even though the RSI remains above the neutral 50 level.
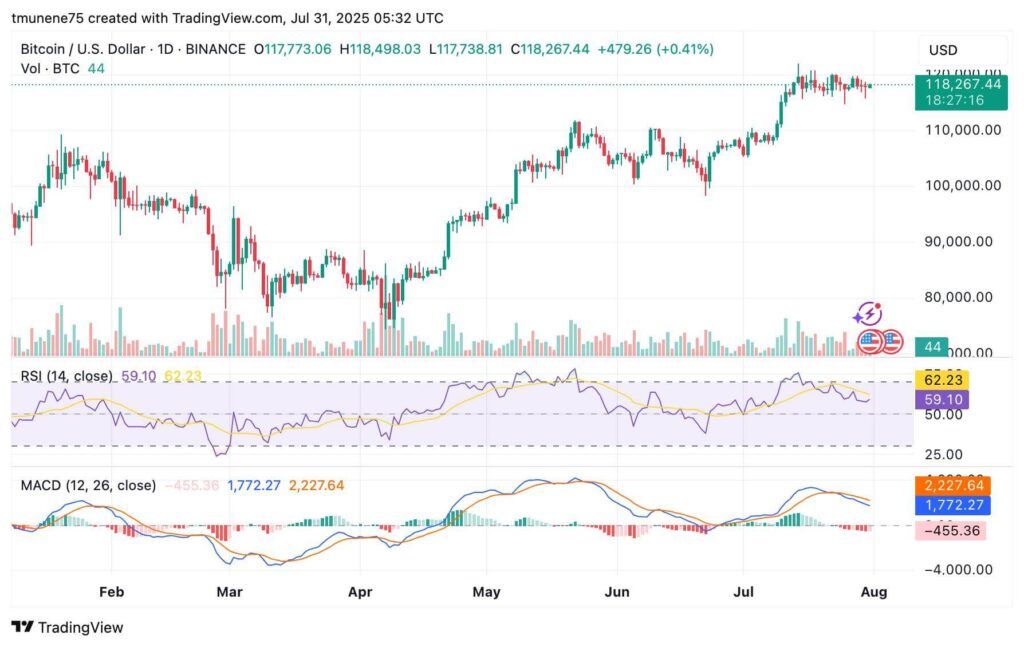
Meanwhile, the MACD presents a bearish crossover. The MACD line is at 1,772.27, below the signal line at 2,227.64. The histogram shows this change with a negative reading of –455.36. These indicators suggest the asset may be entering a period of consolidation or mild correction.
This slowdown has coincided with a drop in volume, currently measured at 44. Prices remain confined within a tight intraday range between $117,738.81 and $118,498.03, following a broad rally from sub-$100,000 levels since early May.
Heavy Liquidation Risk Builds Above $120K With Tight Range Below
The current pattern places Bitcoin just under a short liquidation wall. The zone between $118,000 and $120,000 has now become a focal point. The imbalance between exhausted longs and stacked shorts creates an environment where price could react sharply.
If the price climbs further, it may lead to short liquidations due to the dense concentration of leverage above. However, if momentum continues to fade, price could remain in a narrow band between $115,000 and $118,000. Current conditions show reduced downside pressure due to earlier bull deleveraging and limited long liquidations.