

- 1INCH’s TD Sequential “9” buy signal hints at a rebound, with resistance at $0.3000 and a potential rally to $0.3700 if bulls prevail.
- A breakout above $0.3000 could fuel bullish momentum, while failure might lead to a retest of key support at $0.2200.
- The TD Sequential signal at a strong support zone suggests bearish exhaustion, but 1INCH remains range-bound without clear confirmation.
1INCH could be gearing up for a rebound, as the TD Sequential indicator prints a crucial buy signal. The weekly chart suggests a possible move toward $0.37. The current price action signals growing momentum after a 4.66% increase in the ongoing session.
Price Action and Key Levels
1INCH is trading at $0.2715 after reaching a low of $0.2515 and a high of $0.2789 this week. A strong horizontal resistance level is identified at $0.3700, where past price action faced rejection. Conversely, the key support at $0.2200 has prevented further declines, acting as a critical defense zone for bulls.
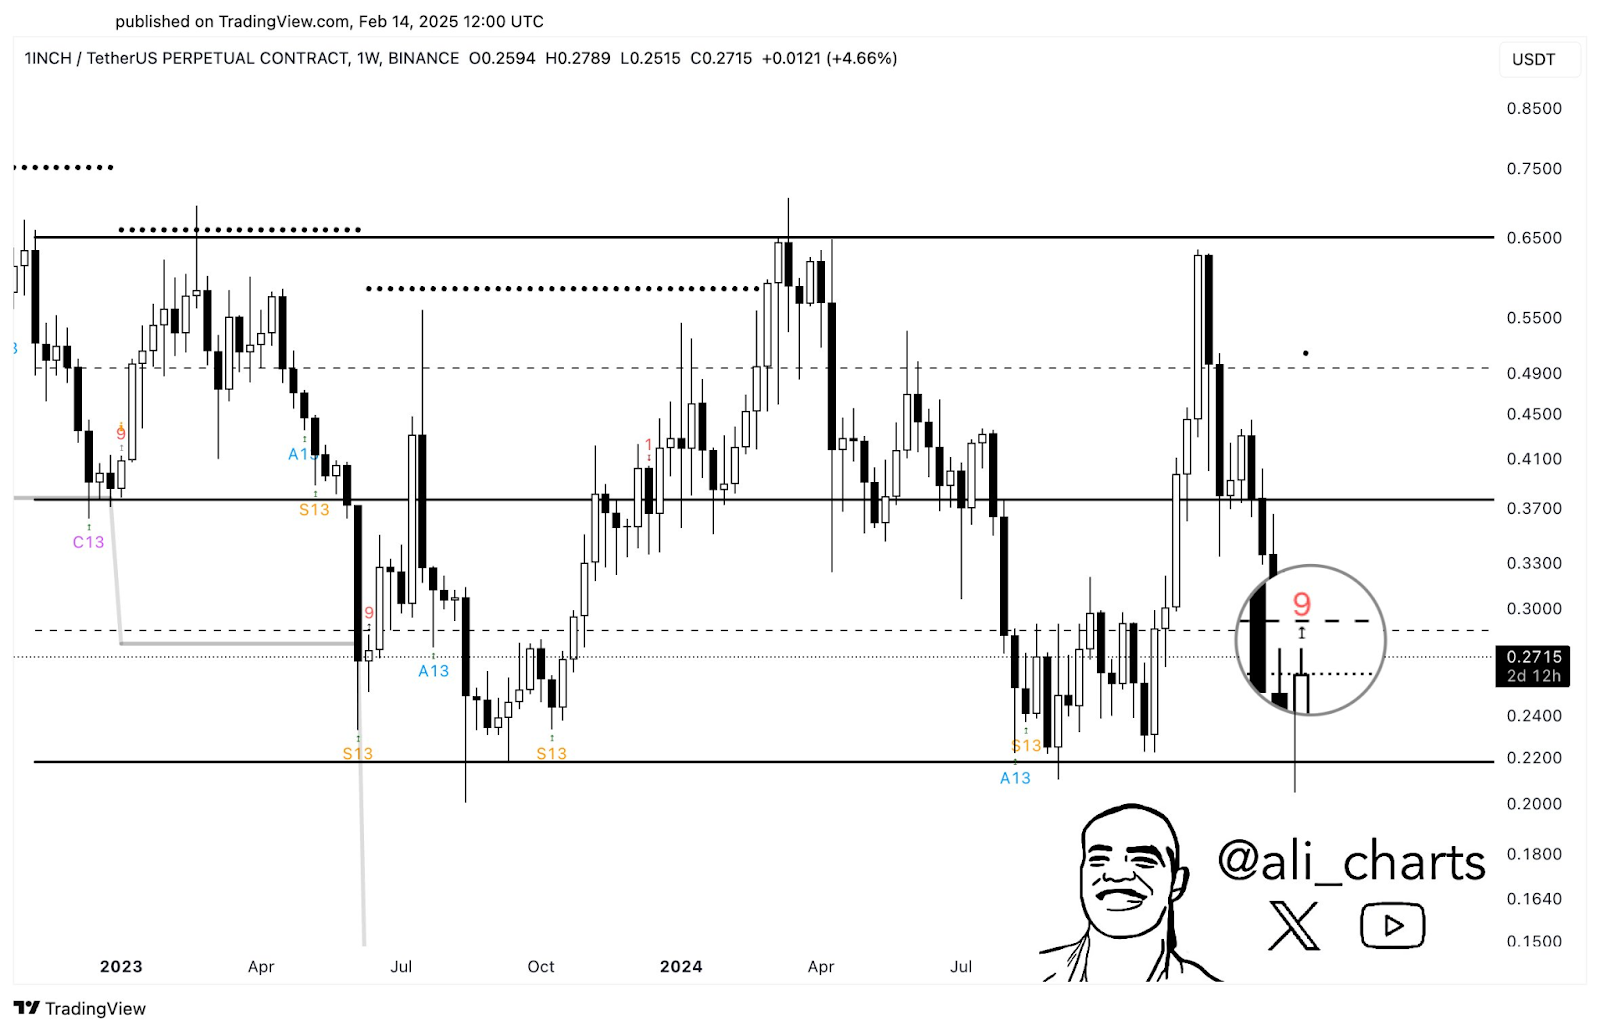
Besides, additional resistance and support zones appear around $0.3000, marking potential decision points for traders. The dotted lines further highlight these crucial areas. Bulls pushing the price above $0.3000 may rally toward $0.3700. However, rejection from this level might trigger another pullback to $0.2200.
TD Sequential Buy Signal
A red “9” signal has appeared on the TD Sequential indicator, historically marking potential reversals or exhaustion points. The last occurrence of this signal resulted in a price retracement. Consequently, traders are closely monitoring this setup to assess its impact on price direction.
Moreover, the lower support region has repeatedly acted as a reversal zone, highlighted by multiple “S13” and “A13” signals. The presence of the TD Sequential “9” near this area suggests a possible slowdown in bearish momentum. However, 1INCH remains range-bound, lacking clear breakout confirmation.
A bullish attitude may be reinforced and the price may move toward $0.3700 if it breaks above $0.3000. There may be a decline toward $0.2200 if selling outnumber purchases. The dotted resistance near $0.4900 remains an essential level for a long-term bullish recovery.